
A brief explanation of Kubernetes Ingress and demo on k3s.
This blog post is one in a series of posts about my experiences of deploying kubernetes to a Raspberry Pi cluster, if you haven’t seen the others i’d advise checking them out here. Today’s blog, is more of a precursor to what is coming next.
How do we expose services on a Kubernetes cluster?
There are a variety of different methods we can use to view the services running on our Kubernetes cluster, a service being a group of deployed pods that can then be viewed under a single cluster IP address. The service does the job of a typical round robin load balancer by hiding the ephemeral nature of the pods it is exposing which are scaled and replaced quickly at any time. However, these services are only accessible from within the cluster itself. This is was apparent at the dawn of k8s and so two mechanisms were directly integrated into service specification, NodePort and LoadBalancer, which can both be easily selected when writing a Kubernetes service manifest. Whilst both of these mechanisms work extremely well in specific circumstances they do have their caveats. NodePort’s random port selection can mean its more difficult to configure other networking rules around it and LoadBalancer only works when using a public cloud-hosted environment (public IP addresses can be expensive!). Defining many NodePort services creates a mess of random ports and defining LoadBalancer services can lead to paying for large amounts of cloud resources.
Ingress
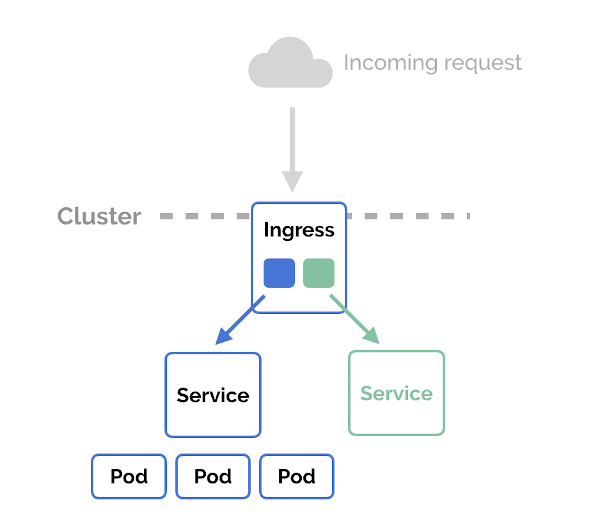
In order to circumnavigate these issues, Kubernetes birthed a new type of manifest, an Ingress. A mechanism, similar to the services mentioned above, that allows clients in an external network to invoke services running in a k8s cluster. Kubernetes defines Ingress as an ‘API object that manages external access to the services in a cluster… Ingress exposes HTTP and HTTPS routes from outside the cluster to services within the cluster’. To manage the access, an Ingress YAML manifest is written that declares the rules about how you want clients to be routed to a particular service. An example can be seen below:
apiVersion: networking.k8s.io/v1
kind: Ingress
metadata:
  name: example-ingress
  namepsace: default
spec:
  rules:
    - http:
        paths:
          - path: /foo
            backend:
              serviceName: foo-service
              servicePort: 80
    - http:
        paths:
          - path: /bar
            backend:
              serviceName: bar-service
              servicePort: 80
Ingress Controllers
The ingress manifest alone is useless, it requires an Ingress Controller which looks at the manifest and acts upon it by dynamically configuring itself based on the YAML objects defined in the resource. Ingress controllers are pods, so they’re part of the cluster, and so they can see all the other pods. They are constructed using reverse proxies which give it Layer 7 routing and load balancing capabilities. Ingress controllers still require them to be exposed externally via a type of either NodePort or LoadBalancer but now there is a single entry point of traffic. As the Ingress Controller is implemented at level 7 it is able to terminate HTTPS, allowing it to distinguish each websites traffic as it understands url names and paths, therefore knowing which backend server to forward traffic to. In the example manifest above, you set up the services for your pods but don’t assign them a type field - routing and load balancing is handled by the Ingress layer. The two paths of /foo and /bar are served by a common IP and domain name. Essentially an API Gateway Pattern. Once installed, Ingress Controllers do all the work in the background, defining Ingress manifests for the controller will be extent of your troubles.
A deep dive into ingress and ingress controllers can be found here.
Reverse proxies have been around for years, as such there is a plethora of ingress controllers to choose from, here are a few worthy mentions:
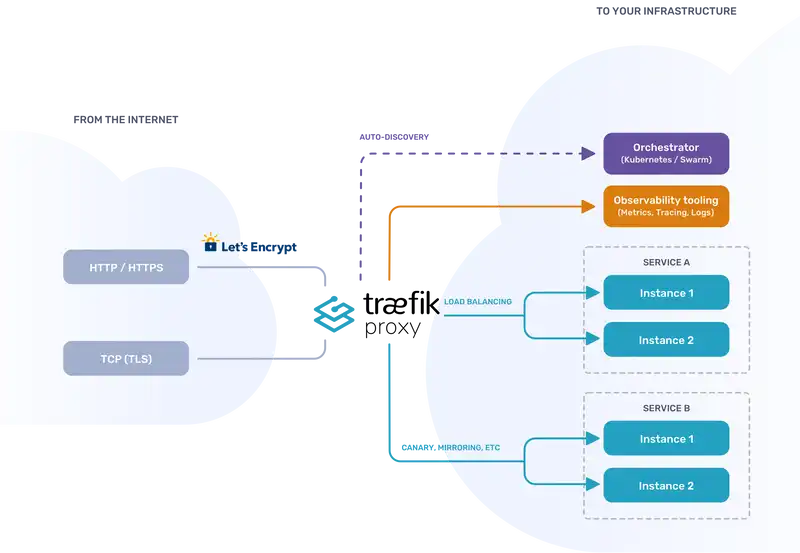
The choice of ingress controller for my cluster is Traefik, this comes as default on Ranchers k3s - boring I know. It is easy to use, production ready and really popular. It’s open source too. Some of its coolest features include:
- Service discovery to configure itself dynamically from the services themselves.
- All major protocols are supported and can be flexibly managed using configurable middle wares; load balancing, rate-limiting, circuit-breakers, mirroring and authentication.
- Supports SSL termination and can be used with an ACME provider such as Lets Encrypt for automatic certificate generation.
 .
.
Ingress Demo
Pre-requisites
- Ensure you have followed the previous blog ;)
- You have k3s running on your Kubernetes cluster
Viewing the Traefik Dashboard
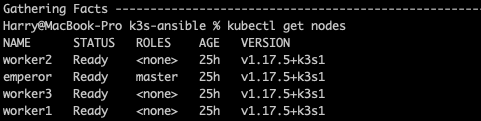
So we can begin by checking our nodes are up and running kubectl get nodes and your output should look something like this:
Lets take a look at what is running on our k3s cluster kubectl -n kube-system get all
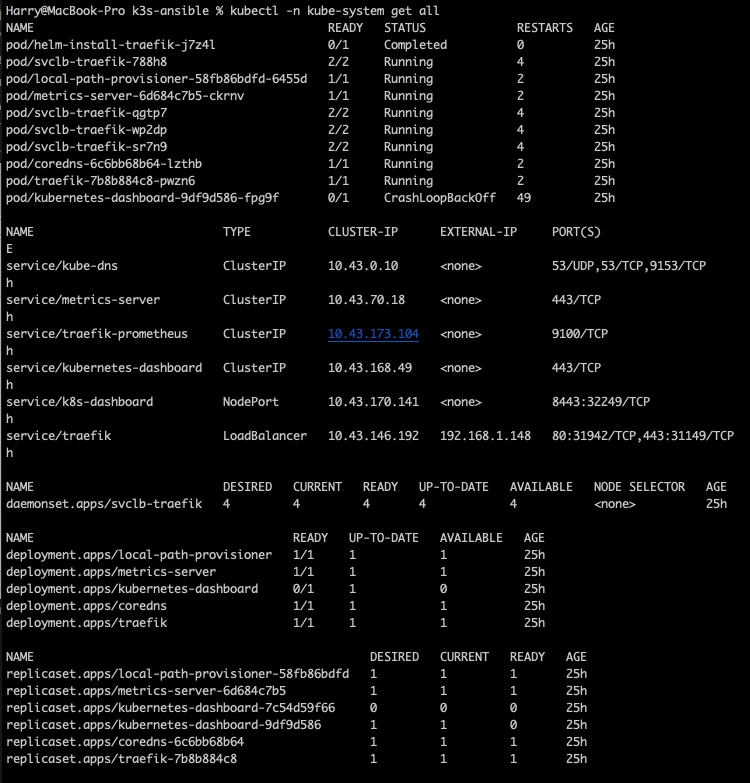
Everything is running fine (ignore kubernetes-dashboard in CrashLoopBackOff 😉 ) and you can see that there is already a pod created containing Traefik.
In k3s the Traefik web UI dashboard is disabled due to its lightweight nature. We can enable this dashboard by editing the config map for Traefik.
Lets see what the config map is called for Traefik by running kubectl -n kube-system describe deploy traefik to show the Traefik deployment:
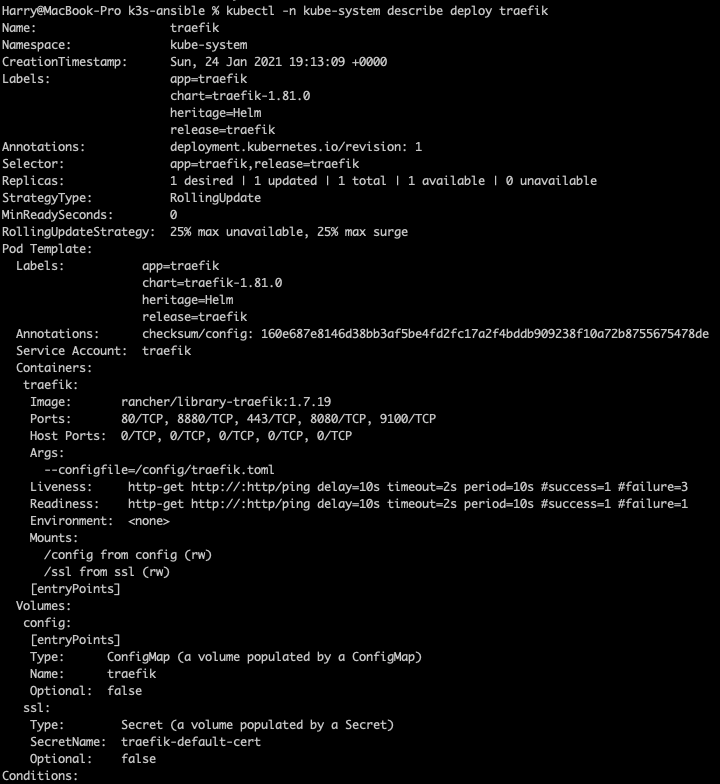
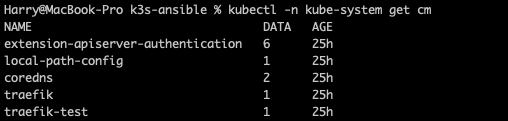
Under volumes, we can see the ConfigMap and it’s name is traefik. Another way we can view the config map is by running kubectl -n kube-system get cm
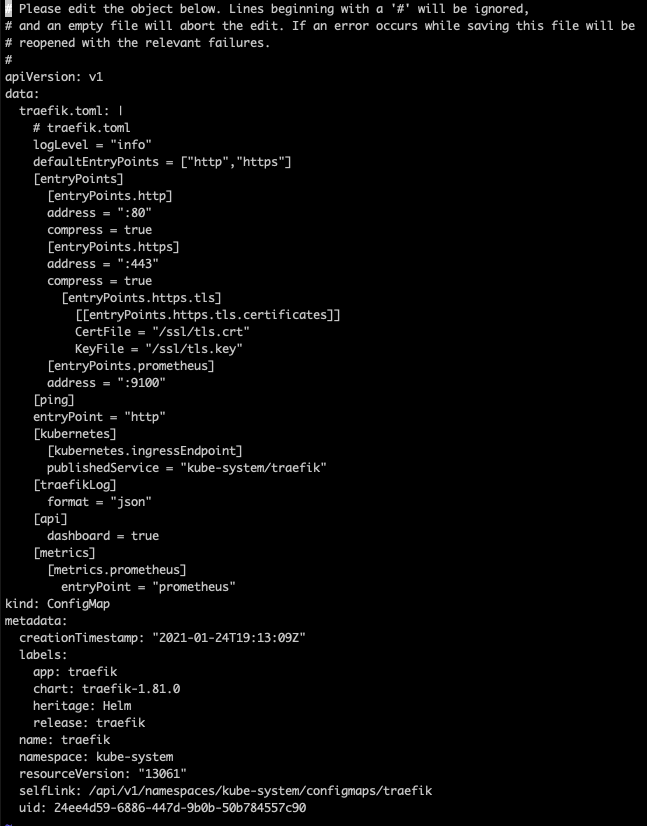
Okay so we know the config map name and that the Traefik dashboard is not enabled on the k3s by default. We can enable it by editing the config map to include the dashbaord. First lets run kubectl -n kube-system edit cm traefik to begin editing, this should bring up the following output.
However, yours will not contain the [api] + dashboard = true you will need to enter this into the config map in the same way as I have done here and then save + exit.
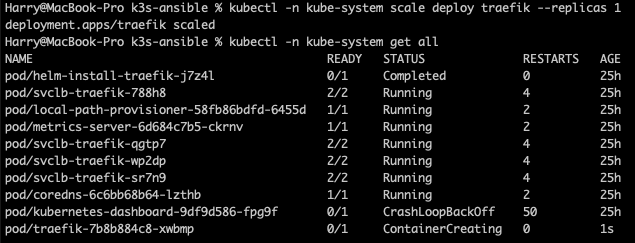
After you’re done editing, the old pod will still be running based off the old config map. We need to reploy the traefik pod with the new config map, lets do this by running kubectl -n kube-system scale deploy traefik --replicas 0 then we can see that the pod is terminating.
![deploy0]/assets/images/Kubernetes/ingress-post/deploy0.png)
Then lets recreate the pod with the new config map by running kubectl -n kube-system scale deploy traefik --replicas 1 and allow a minute or two to finish up creating the pod.
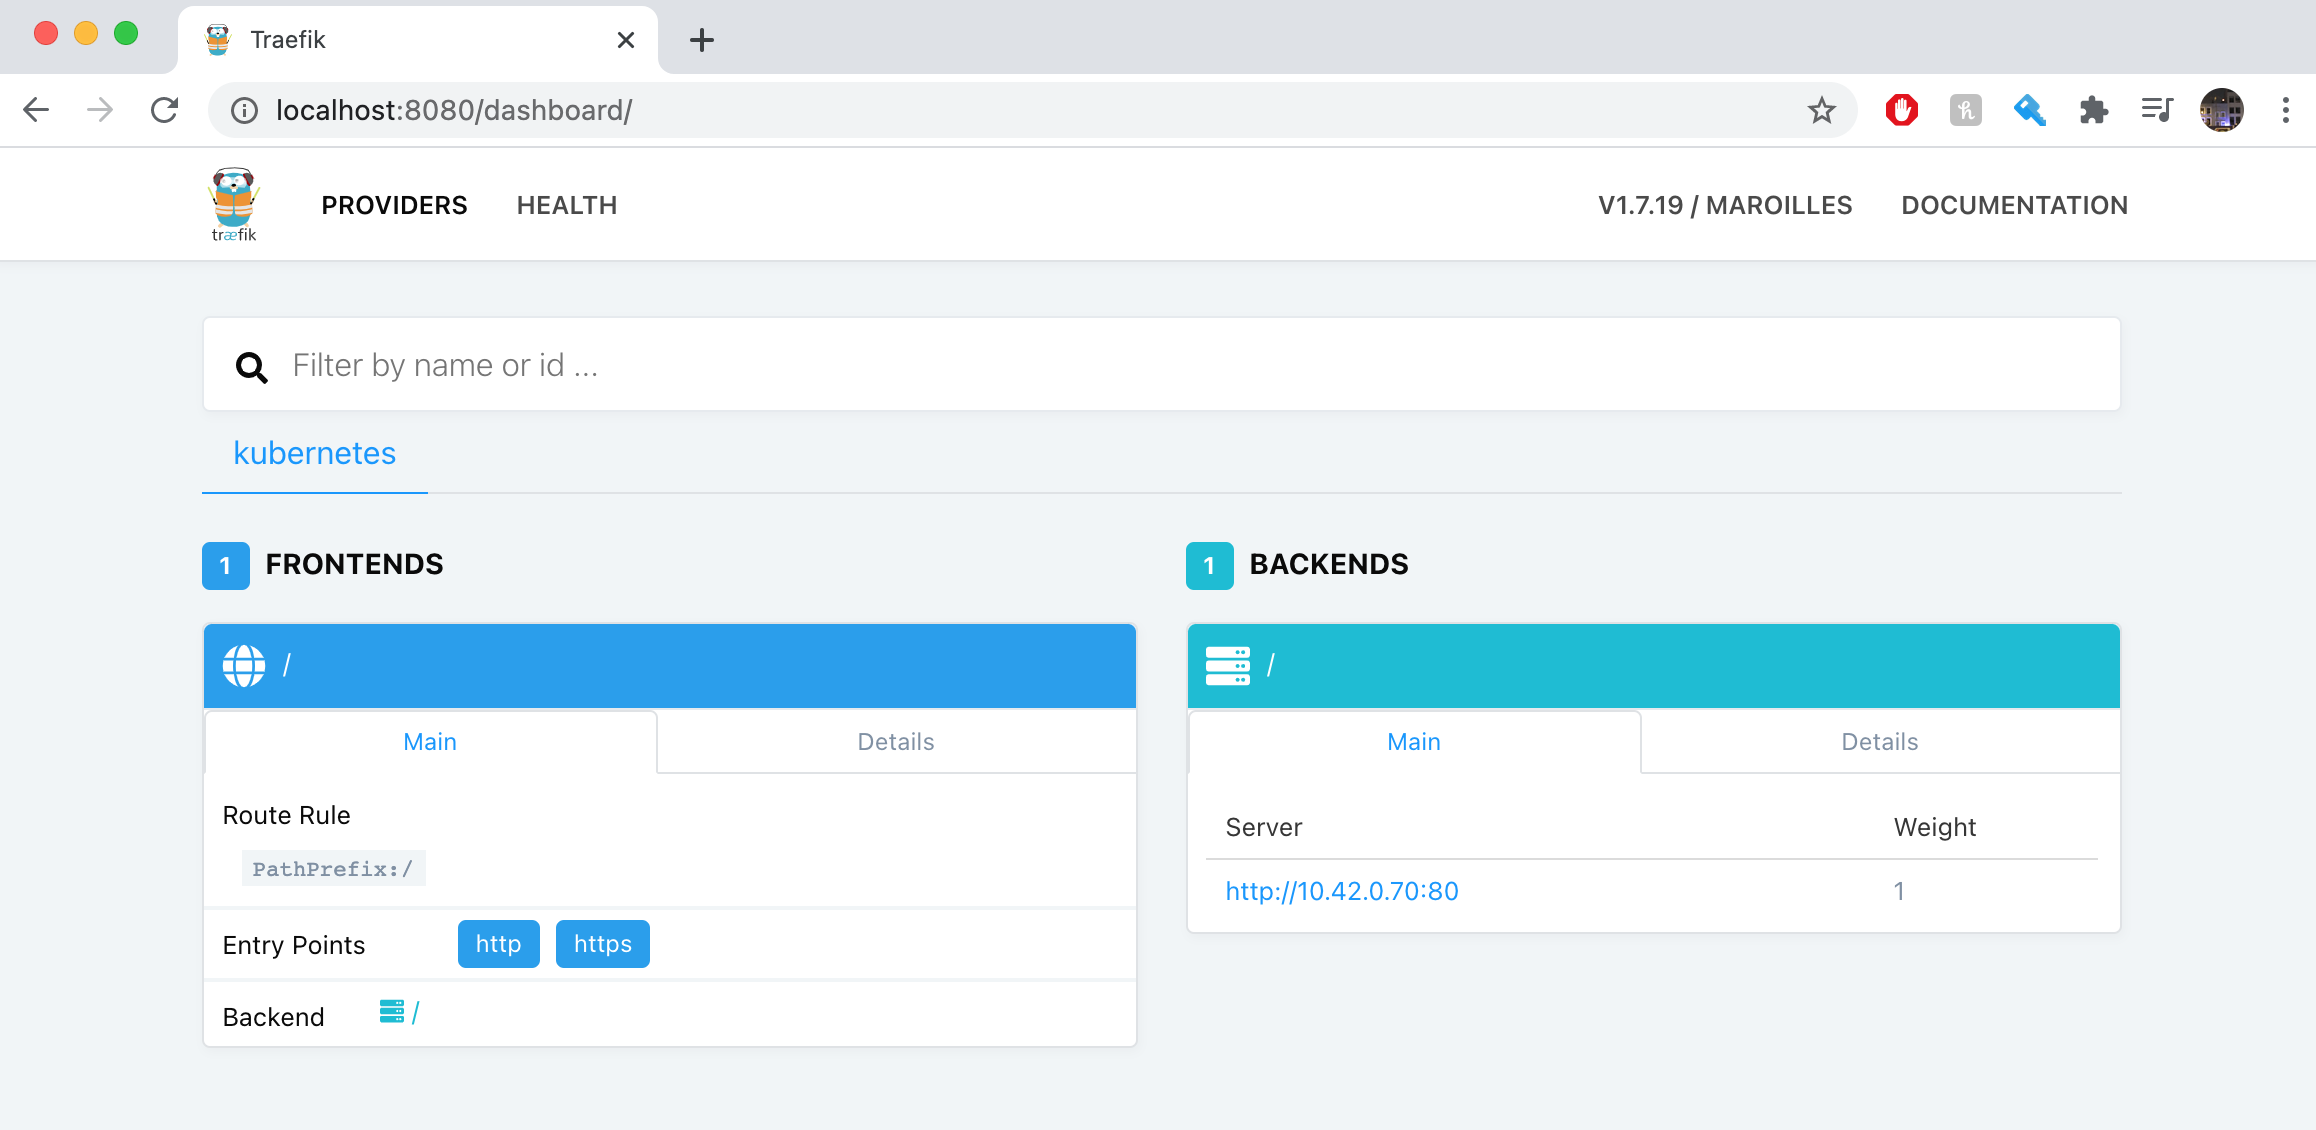
Now, to view the Traefik dashboard we will need to use port forwarding on the traefik pod to view it locally on our own device. Open a new tab on your shell and run the following kubectl -n kube-system port-forward deployment/traefik 8080 whilst this contiues to port forward, opening up [localhost:8080](http://localhost:8080) in your browser should return the Traefik dashboard:
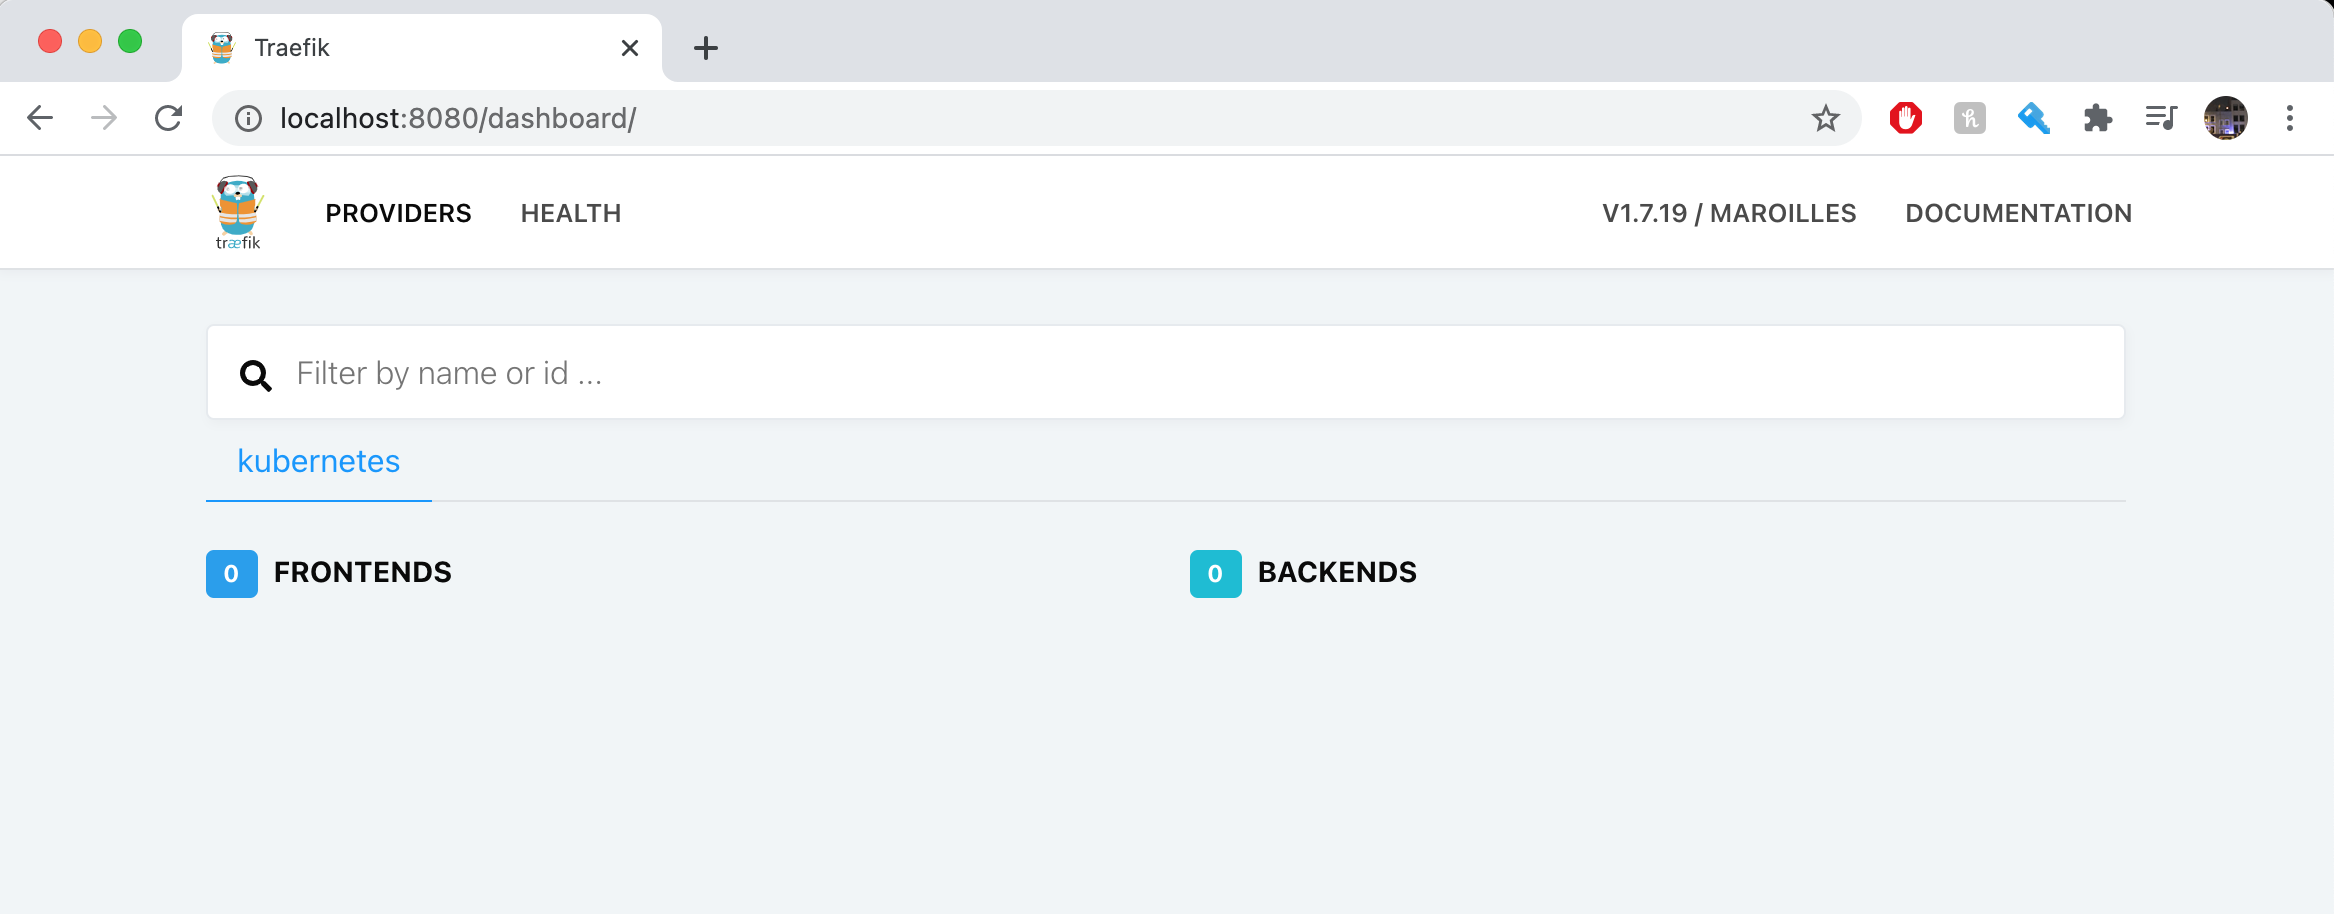
Here, we can see that there are no front ends or backends as we don’t currently have an Ingress set up.
Setting up an Ingress
Let’s deploy a sample nginx web application as an example Ingress exposure.
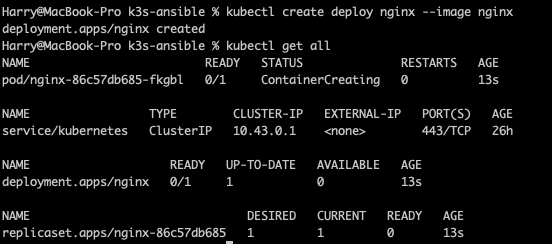
First lets create the web application in our cluster and grab the nginx image:
kubectl create deploy nginx --image nginx
Now we can expose the nginx deployment using a service, in this case we can use ClusterIP as the service type and on port 80 kubectl expose deploy nginx --port 80
We can check the service by running kubectl get svc this will return the following.
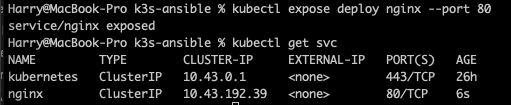
Here we have exposed the nginx service using ClusterIP with the corresponding IP on port 80 BUT this is still only accessible from within the cluster so we cannot access this externally. You can now create the ingress YAML manifest (or you can use the one below):
apiVersion: extensions/v1beta1
kind: Ingress
metadata:
  name: nginx
  annotations:
    ingress.kubernetes.io/ssl-redirect: "false"
spec:
  rules:
    - http:
        paths:
          - path: /
            backend:
              serviceName: nginx
              servicePort: 80
I saved mine within a folder called example and named it ingress.yaml
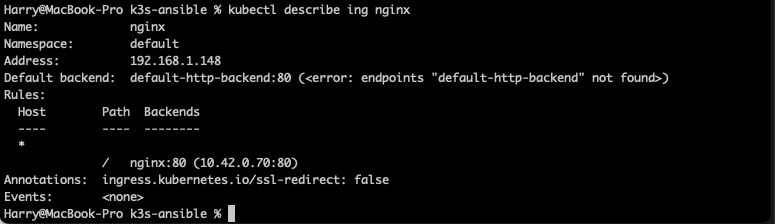
Next let’s create the ingress kubectl create -f example/ingress.yaml and we can see the ingress creation by running kubectl describe ing nginx.
We can also see on the Traefik dashboard that an Ingress rule has been created.
Now we have created the ingress service we should be able to access it, we can confirm that this has been exposed by heading to the IP of any of our nodes on our browser. Here they should display the nginx Welcome Page.
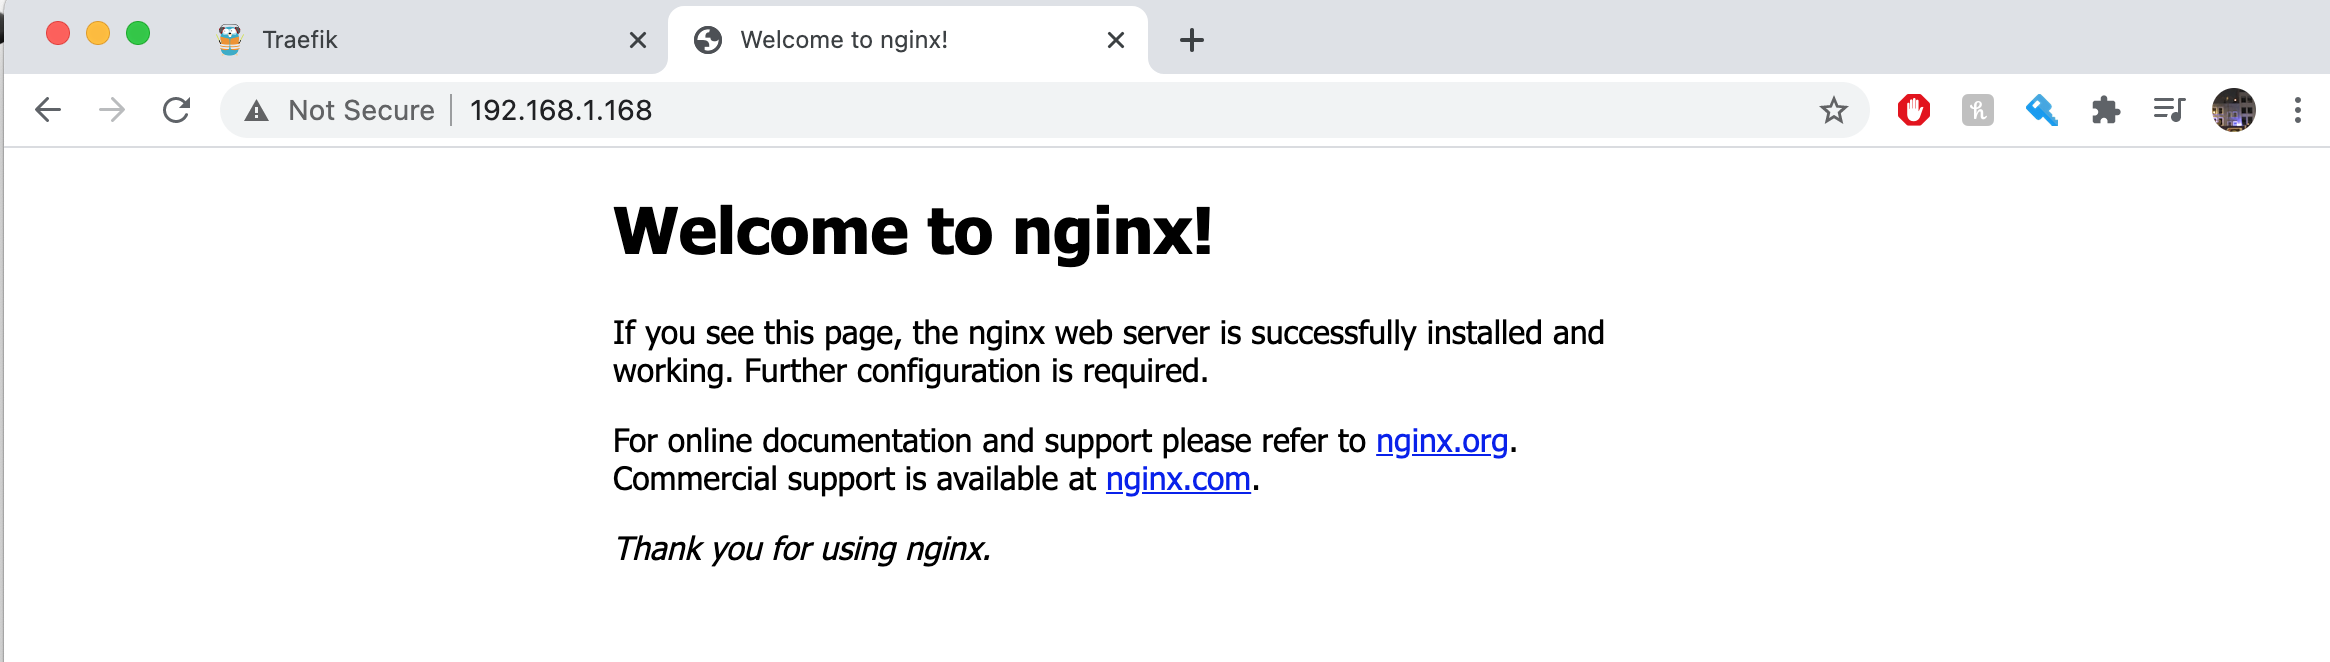
Congratulations, you have deployed your ingress resource successfully!
This explanation and ingress demo walkthrough would not have been made possible if not for the following amazing people:
I’ll be back next week discussing all things monitoring and walk you through how to deploy a monitoring stack of your own.