
Discussion of monitoring in Kubernetes clusters, best practices and tooling choices.
Monitoring in Kubernetes
As previously discussed, Kubernetes does a great job at simplifying a lot of the complexities involved with modern application deployments, improving their speed and availability (and a whole host of other things). As always, there is a consequence of such simplicity - monitoring is made more difficult. K8s clusters are generally harder to observe, pods / containers within the cluster are ephemeral and there are further layers of infrastructure complexity. If you’re not careful this can be a disaster for any production environment; you can end up with a gross amount of logs and metrics with no meaningful analysis, this can lead to misalignment and poor optimisation of your clusters resources. Ultimately, resulting in a poor product. In the modern era of agile, highly available applications this is not acceptable.
As IBM states, consumers nowadays don’t care about the underlying tech, they care more about the service they are receiving and as a result ‘slow is the new down’.
This isn’t to say that your Kubernetes cluster is guaranteed to have bottlenecks and be poorly optimised without monitoring. Instead, that monitoring helps to proactively keep on top of any live issues and is an effective way to anticipate problems before they ever arise. While Kubernetes offers significant improvements for modern cloud-based applications it is essential for businesses to adopt a new approach to monitoring in order to fully reap those benefits. A great article from a Netflix developer here discussing in length what they have learnt in the early years of adopting Kubernetes and the challenges they faced with monitoring their clusters
What makes kubernetes different from traditional monitoring?
Kubernetes is more complex; there are a lot more moving parts that go into its architecture that more traditional monolithic virtualisation deployments, the behaviour of pods and containers within a cluster is harder to track and kubernetes adds a whole new layer of infrastructure to a deployment.
Multi-layered architecture:
Infrastructure and Kubernetes components: The entire deployment is a cluster. Inside each cluster are a set of nodes. Each node runs one or more pods. The nodes are managed by a control plane. Inside the control plane are many smaller pieces (kube-controller, kube-api-server, kube-scheduler, etcd.). There’s a lot of parts!
Application layer: A top the infrastructure and kubernetes layer, you have the applications running on them. These apps contain many different variables and are dynamically scheduled.
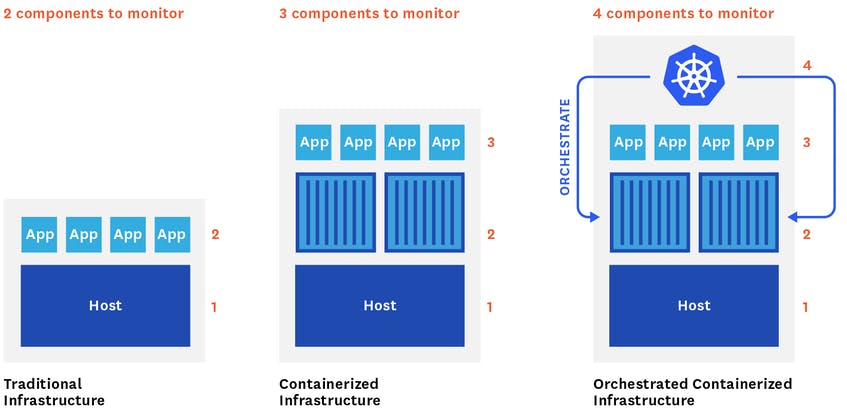
Source: https://www.datadoghq.com/blog/monitoring-kubernetes-performance-metrics/#control-plane-metrics
Ephermeral nature
Containers may only be alive for a few minutes at a time - they are ephermeral. The deployment elements of k8s i.e. DaemonSets, Jobs, Deployments and StatefulSets can all generate new pods or containers to monitor or, when scaling down, can have pods disappear completely. Once they’re gone, they’re gone forever.
Microservices Architecture and Lack of Observability
Modern applications are broken down into various components are loogsely coupled into something known as a microservice and these microservices are then kept in containers. In doing so allows all services to be operated independently and designed so that a change to any one service won’t significantly affect other services. Kubernetes does the job distributing workloads by tracking the state of the components and ensuring they’re available and ready. This means that each service can be distributed acorss multiple instances and containers are free to move across your infrastructure as needed. This can creates issues with observability of your resources and workloads.
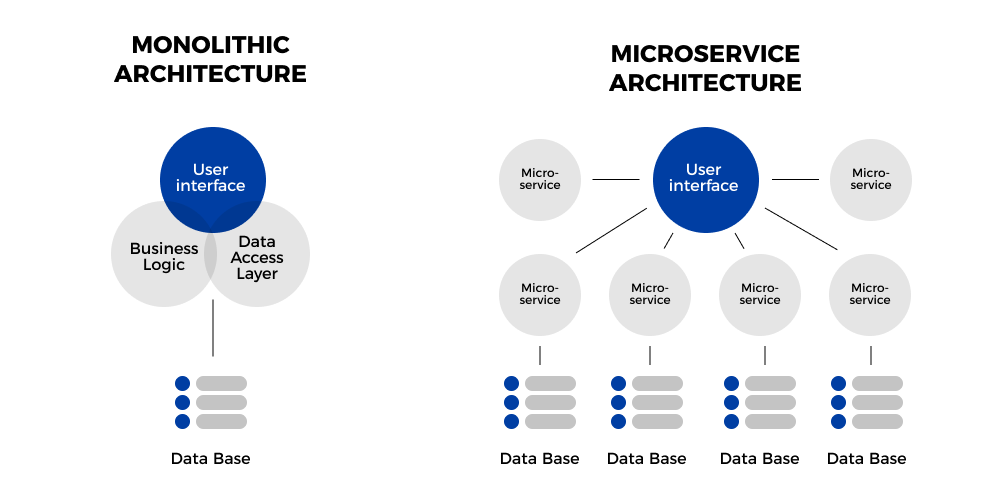
Source: https://divante.com/blog/monolithic-architecture-vs-microservices/
As well as this, increasing amounts of contemporary application architecture involves building stateless applications inside of Kubernetes clusters. Where applications will avoid storing any client session data on the serve. Any session data storage is handled on the client-side. Since no session data is stored on the server, there is also no need for any particular client connection to be favoured over another client connection. Therefore, the application will treat each connection as its first and can easily load balance across multiple instances. This enables horizontal scaling by deploying instances of the application on multiple servers and then distributing all incoming client requests amongst the available servers.
It clear then that a different approach needs to be taken with Kubernetes monitoring over the traditional approaches that were used in monolithic deployments.
How do you go about monitoring a Kubernetes cluster?
Metrics and Logging
Metrics are a set of numbers that give information about a particular process or activity and are usually measured over intervals of time (a time series). Due to the fact metrics are just numbers measured over time, it leads them to be compressed, stored, prcoessed and recieved far more efficiently. Using metrics you can aggregate data over a period of time, helping you to understand how a partilcular application or infrastructure may operating under various loads.
Logs are an immutable record of discrete events that happened over time, and logging involves writing those records to a file or stdout. They can include thigns like timestamps and details about an event that occured e.g. a log may contain information about a malformed HTTP request or incldue information about the requesting as well as information about what sepcifically went wrong with the request. They are fantastic at providing valuable insight and ample context which make them great for investigation and troubleshooting. However, they are operationally (volume) and monetarily expensive (to store).
Both have a place in monitoring k8s clusters and applications, Googles SRE team tend to be the go-to on a lot of things, including monitoring and they do a great job at stimulating discourse on best practices when monitoring production environments - reducing congitive load, symptoms vs causes and blackbox vs whitebox.
Monitoring Guidelines
Googles SRE team have written a small handbook on Kubernetes and in it developed a set of monitoring principles known as ‘The Golden Signals’ (Latency, Traffic, Errors and Saturation).
The following two monitoring guidelines are ‘spin offs’ of Googles Golden Signals and provide a less comprenhensive approach for different use cases.
- Brendan Greggs USE Method (Utilisation, Saturation and Errors) - Monitors the performance of a system
- Weaveworks RED Method (Rate, Error and Duration) - Monitors the services on a system
What to monitor?
A breakdown of the individual components within a Kubernetes cluster architecture that you should be keeping an eye on when monitoring:
- etcd: stores configuation information
- kube-apiserver: validates and configures data for API objects such as pods, services etc.
- kube-scheduler: manages workload utilization and the allocation of pods to available nodes
- kube-controller manager: daemon responsible for collecting and sending inforamtion to the API sever
- cloud-controller-manager: runs controllers that interact with underlying cloud providers
- Kubernotes node components include:
- Container runtime (e.g. Docker)
- kubelet: primary node agent that watches for pod specs via API server; it also registers a ndoe with the Kubenetes cluster and reports evens, pod status and resource utilisation
- kube-proxy - a proxy service that runs on each node and helps make services available to the external host
Best practices:
By following best practices, understanding what it is you’re monitoring and why, you can obtain deep visibility to ensure your system has high availability, efficeint resource usage and better performance.
1. Use DaemonSets
DaemonSet is the Kubernetes object workload that ensures a particular pod runs on every node in the cluster, or a subset of nodes. In this way a DaemonSet can be used by multiple monitoring software apps (like the ones we will discuss later) to ensure that say logs are collected on every pod running in a cluster. This helps users more easily gather data.
2. Tags And Labels Matter
Tags and labels become essential in Kubernetes for moniotinrg because they are the only way you have to interact with pods and containers. As a result, tagging will aid you in making your metrics as useful as possible.
3. Use Service Discovery
Kubernetes deploys services according to scheduling policies, we don’t know where or which node our app will be deployed on. A monitoring system that uses service delivery will automatically adapt metric collection to moving containers, allowing you to continuously monitor applications without interuption.
4. Kube-System
- The most complex issues occur within the Kubernetes cluster – this can be the result of DNS bottlenecks, network overload, and, the sum of all fears – Etcd.
- It’s critical to track the control plane, this is the brains of your cluster. Identify issues before they happen; load average, memory, and disk size.
Common Monitoring Tools
Metrics: Prometheus & Grafana
The following can be used in conjuction with one another (we will be deploying these tools to our Raspberry Pi cluster in part 2):
Prometheus: One of the most commonly deployed metrics toolkits to a k8s clusters. The official monitoring server sponsored by CNCF. Some of its key features:
- Server that scrapes metrics data from enabled applciations and is also the database that stores the time-series data obtained from the applications
- PromQL is the Prometheus Query Lanugage used to query the database
- Client libraries for a variety of lanuages
- and MORE
Grafana: Open-source visualisation and analytics software. It provides you with tools to turn time-series data into customisable dasashboards, graphs and visualisations and lets you query, alert on and understand your metrics no matter where they are stored.
- Easily integrates with Prometheus using PromQL
- Pre-built dashboards are readily available online
Source: https://codevalue.com/grafana/
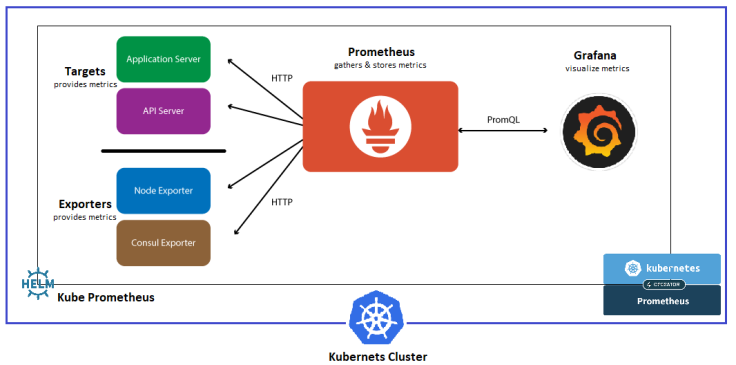
Flow of metrics in Prometheus and Grafana:
- Prometheus pulls metrics data from the applications from a /metrics endpoint (on port 5000) periodically. The use of Kubernetes annotations enables Prometheus to discover pods annotated with the appropriate set of Prometheus annotations.
- Prometheus stores the metrics data in its own time-series database.
- Grafana then leverages PromQL to create dynamic dashboards that can be used to visualise the metrics data.
Logs: Elasticsearch, Fluentd and Kibana EFK Stack
Elasticsearch: Real time distributed and scalable search engine. Allows for full text and structured searches. Data will flow into Elasticsearch from a variety of sources, including logs, where they are indexed and users can then run complex queries against their data and use aggregates to retrieve complex summaries of their data (Kibana is the UI companian of Elasticsearch).
Fluentd: Log data collector. Scraps logs from a given set of sources, processes them into a structured data format and then forwards them onto other services (Elasticsearch). It has the ability to unify data collection through tagging and consumption for better understanding and use of data.
Kibana: Data visualisation front end tool. It will create a dashboard for Elasticsearch. Allows you to explore the log data through a web interface and, build dashboards and queries to quickly answer questions and gain insight into your Kubernbetes applciations.
Source: https://www.techmanyu.com/microservices-logging-using-efk/
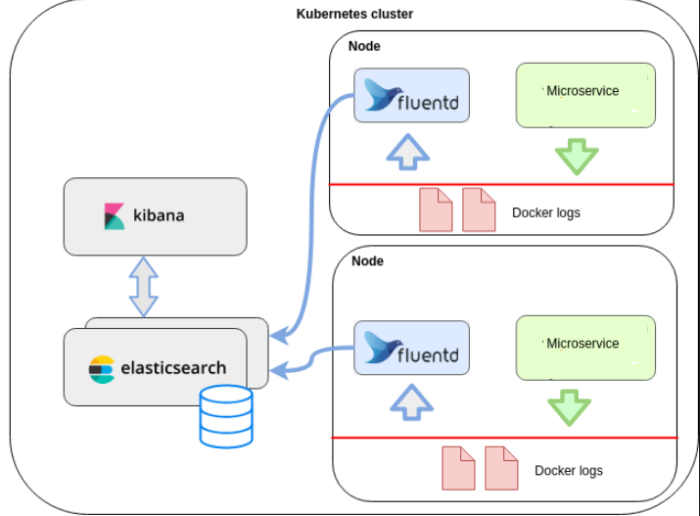
The flow of logs in EFK:
- The container will log to stdout.
- Fluentd is running on the same node as the pod/container and captures the stream of log messages
- Fluentd can be configured to forward log messages to a number of back ends, including Elasticsearch
- Elasticsearch will store and index, as much as possible, the log messages it receives from Fluentd. Structure logging signficiantly improves elasticsearchs ability to idnex log messages.
- Kibana is able to query the Elasticsearch database and is able to present the results as a visualisation.
In the next post i’ll be deploying the Grafana, Prometheus & EFK monitoring stack to the bare metal Raspberry Pi cluster and walking through each step of how I do it!
References:
https://www.weave.works/blog/the-red-method-key-metrics-for-microservices-architecture/
https://www.ibm.com/garage/method/practices/manage/golden-signals
https://logz.io/blog/kubernetes-monitoring/
https://thenewstack.io/why-monitoring-kubernetes-is-so-challenging-and-how-to-manage-it/
https://opensource.com/article/19/10/open-source-observability-kubernetes
https://www.techmanyu.com/microservices-logging-using-efk/
https://medium.com/techmanyu/logstash-vs-fluentd-which-one-is-better-adaaba45021b